The mirage of retention
Ask any SaaS executive what defines success, and the first number you’ll hear is Net Revenue Retention. But NRR can deceive. It flatters companies with expansion in legacy accounts while masking churn among newer ones. The result is a Retention Mirage: growth on paper, erosion in reality.
Retention is the KPI Customer Success is most visibly held accountable for, because CS is expected to make revenue recur by reading and acting on the signals beneath the NRR.
If you can’t explain where your NRR comes from, you don’t have a retention metric you can actively manage. You have a composite that can be carried by a few accounts for a while.

Why Most SaaS Companies Track the Wrong Retention Metrics
The industry loves to celebrate Net Revenue Retention above 120%. Yet many of those same companies struggle to raise their next round of funding or meet growth targets. The problem isn't the metric. It's that they're measuring only part of the story while missing the warning signs hidden inside the base.
For Customer Success teams running high-touch enterprise portfolios, the gap between “headline retention” and reality is especially dangerous. A single lost enterprise client can represent 5-10% of ARR, yet many CS teams track the same metrics and operate with the same dashboards used for mid-market or SMB motions.
This is not about tracking more metrics. It's about tracking the right ones at the right time, with the precision needed to make decisions that compound value over years, not quarters.
The Retention Mirage
NRR is one of the strongest signals investors watch because it compresses a lot of information into a single line: churn, contraction, expansion, and pricing power. But that compression is also the trap. NRR can look world-class even when the base is quietly decaying.
Here is the uncomfortable math you should internalize: a company can experience high logo churn and still report impressive NRR if the oldest customers’ cohort expands aggressively (seat growth, new modules, price uplift). That may be mathematically possible, but operationally dangerous.
The mirage isn’t “NRR is wrong.” The mirage is “NRR is enough.”
Metric Definitions You Must Standardize Before Debating Benchmarks
Before you compare yourself to anyone else, align internally on definitions. Otherwise, we can spend months arguing about improvements that exist only in the spreadsheet.
NRR (simplified):
(Starting ARR − Churned ARR − Contraction ARR + Expansion ARR) / Starting ARR × 100
Define explicitly:
ARR churn vs Logo churn (the difference is not academic; it changes strategy)
Churn vs Contraction (lost accounts vs down-sells)
FX effects, pauses, write-offs, partial terminations, and re-structures
The distinction between Retention Rate and Renewal Rate (eligible-to-renew)
The Three-Layer Metrics System

This is not a dashboard. It’s a revenue operating system: leading indicators that prevent retention surprises. Think of Customer Success metrics as a hierarchy:
Layer 1: Revenue Reality
Layer 2: Engagement Reality — predicts Revenue Layer 1
Layer 3: Sentiment and Commercial Reality — influences Layer 2
This structure matters because retention failure is rarely sudden. It’s usually visible. First in behavior, then in relationship signals, and finally in revenue outcomes.
Layer 1: The Revenue Foundation
Net Revenue Retention (NRR) by cohort, segment, and ACV band tells you whether your existing customer base is growing or shrinking in value. Used correctly, it is a powerful indicator of revenue quality and future growth capacity.
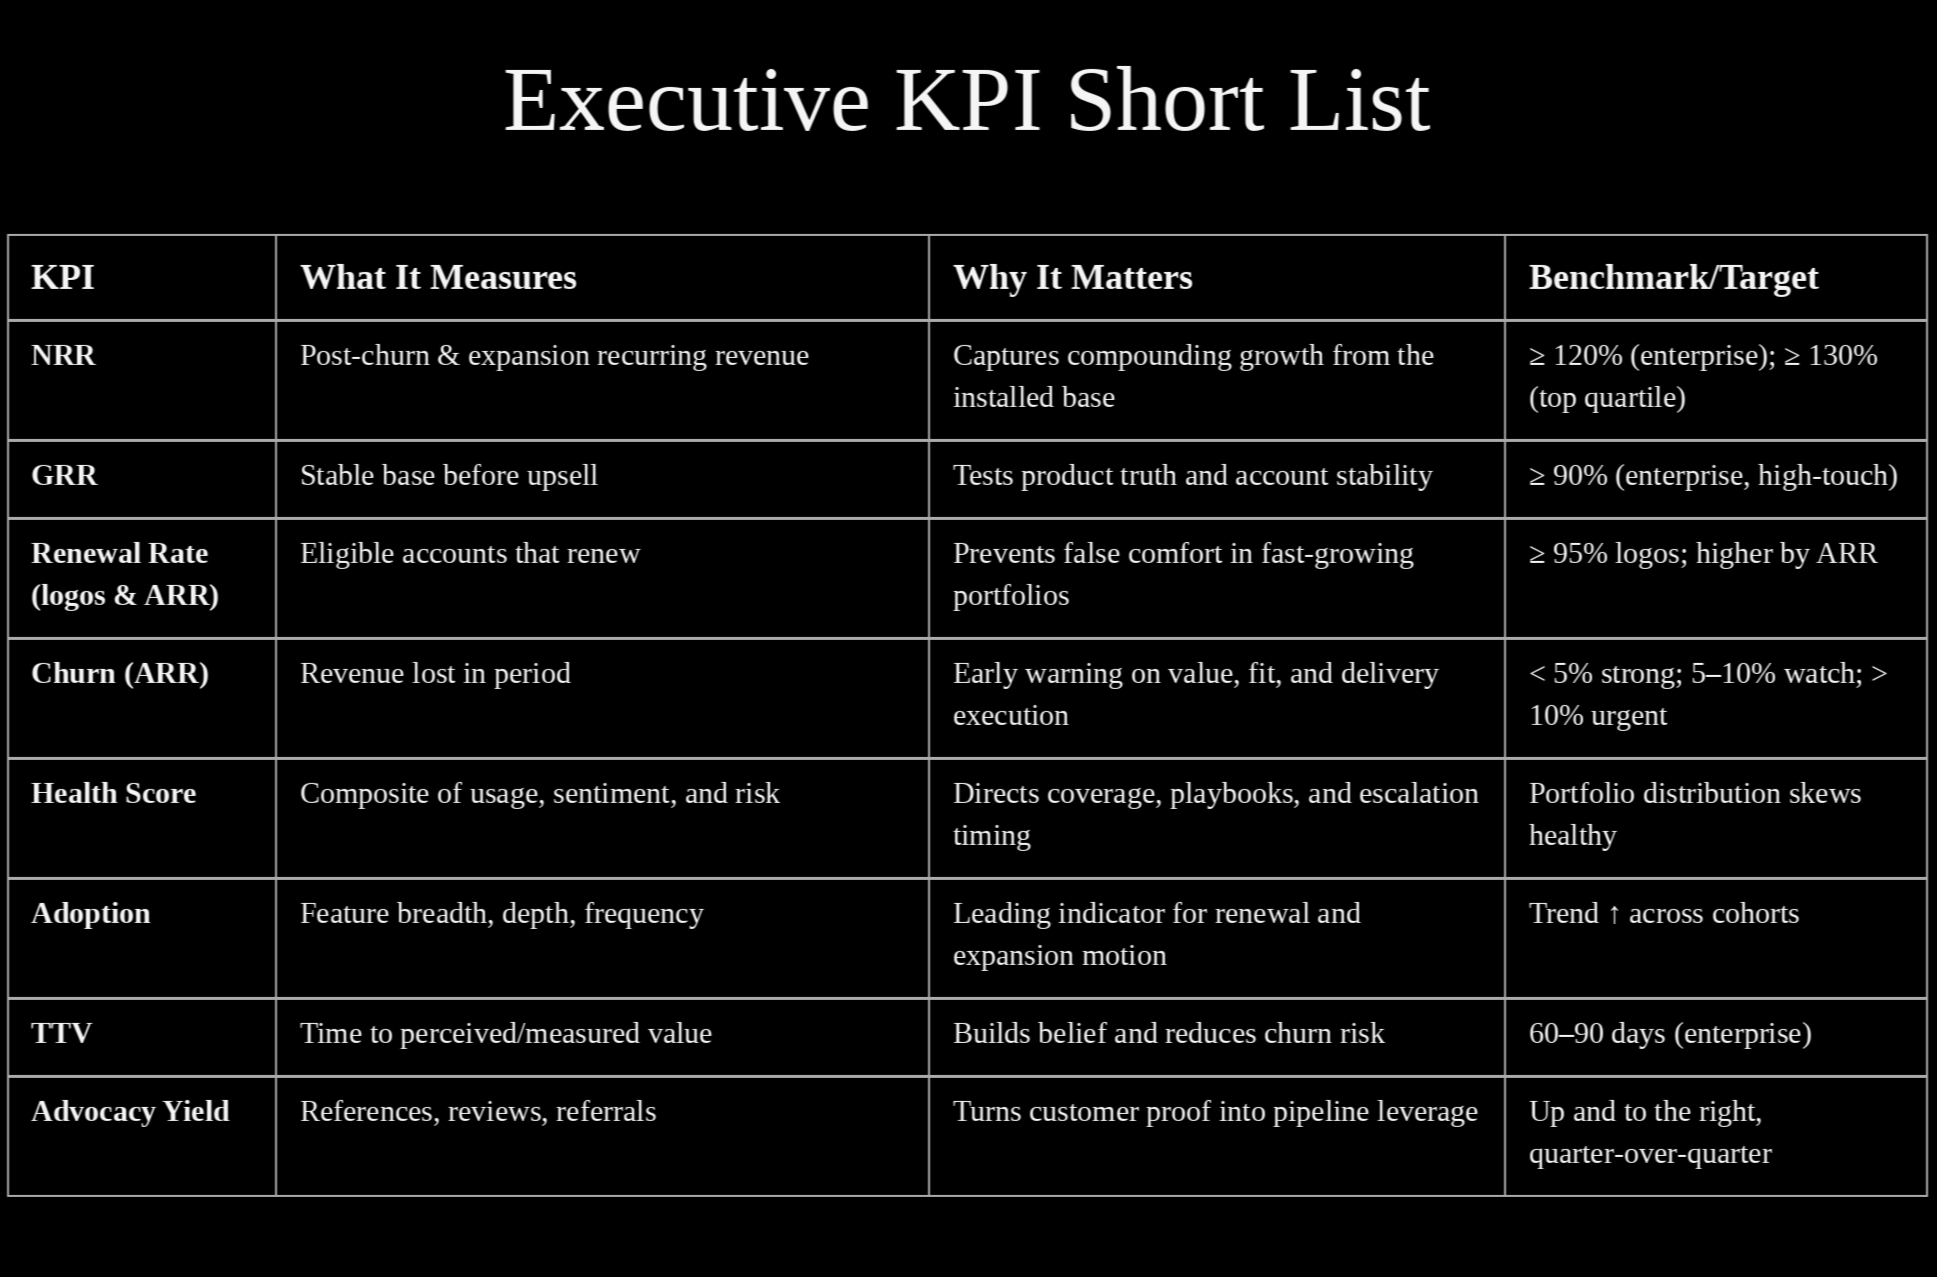
What the benchmarks actually mean (as directional ranges):
NRR ≥ 130%: You can grow 30% meaningfully without signing a single new customer.
NRR 110-130%: Healthy expansion motion, but new logos still matter for aggressive growth.
NRR 100-110%: You are replacing churn with expansion. Growth becomes sales-dependent as it requires constant new customer acquisition.
NRR < 100%: The existing base is shrinking. Every Euro of growth requires more than 1 Euro of new sales.
The NRR trap nobody talks about: a company with 20% logo churn can still report 120% NRR if expansion revenue from surviving customers is large enough. That is not “success.” It is often a warning that growth is being carried by a narrowing segment.
Illustration (anonymized, but common): a ~40M Euro ARR vertical SaaS company reported 118% NRR but had 22% logo churn among customers in their first two years. Expansion revenue came primarily from customers who had been with them 3+ years. New customers churned at 2-3x the expected rate, but the NRR number masked the problem. When we projected forward 24 months, the math collapsed.
Gross Revenue Retention (GRR) excludes expansion and shows the percentage of revenue you retain before any upsells or cross-sells. It's the purity test for product-market fit, a measure of stability.
Benchmarks (directional):
GRR ≥ 95% (enterprise, high-touch): strong product fit and delivery with sticky use cases. Sustained GRR below ~95% is a red flag that often points to product-market fit or value-delivery issues.
GRR 85-95% (mid-market): can be acceptable if expansion is strong.
GRR < 85%: critical territory regardless of segment.
For enterprise SaaS with high-touch CS, GRR below 95% is a red flag. When GRR drops below 90%, expansion becomes artificially important: you're not growing, you're backfilling.
Renewal Rate (Eligible-to-Renew) measures what percentage of customers who could churn actually renew. This differs from the overall retention rate, which can appear inflated because it includes customers who can't churn while they're still under contract.
If you're growing fast, your overall retention rate may appear strong because most customers haven’t had a choice yet, as they are still in their first contract. The renewal rate shows what happens when they actually have a choice. For enterprise portfolios, logo renewal typically targets the mid-90s, with ARR renewal expected to be higher, depending on the mix and pricing structure.
Logo renewal rate tells about relationship health. ARR renewal tells about business impact. You need both to understand what is really happening.
Layer 2: The Engagement Engine
Engagement metrics indicate what's likely to happen. But only if they are designed to predict outcomes.
Customer Health Score is only useful if it predicts renewal and expansion outcomes. Most companies build health scores that feel right but don't correlate with revenue reality.
How to build a health score that actually works: start with 24 months of renewal data, segment customers (churned vs renewed vs expanded), test which behaviors predict these outcomes, and weight inputs based on predictive strength, not gut feel.
A mature health score typically includes:
Product adoption (40%): feature breadth, seat utilisation, usage frequency
Relationship quality (25%): executive engagement, QBR cadence, strategic alignment.
Support telemetry (20%): open issues, ticket trends, incident signals.
Commercial posture (15%): days to renewal, payment behavior, procurement complexity.
For high-touch strategic accounts, consider weighting relationship quality higher (35-40%). In complex enterprise sales, executive sponsor turnover or disengagement is often the leading indicator of churn risk, even when product adoption remains strong.
And here is the part most teams avoid: the distribution matters as much as the score. If 60% of your ARR is in "yellow" health, you don't have individual account problems. You have a systemic delivery issue.
Time to First Value (TTV) is the elapsed time between contract signature and the moment the customer achieves a measurable outcome they care about. Not a feature your customer used, but a result they can quantify.
Value is defined by the customer's KPI, not your product roadmap. Interview customers who renewed and ask: "When did you know this was going to work?"
Benchmarks (directional): Enterprise SaaS with complex integrations: 60-90 days is strong. For strategic accounts with change-management complexity, 90-120 days can be acceptable. Mid-Market SaaS: 30-45 days. PLG/self-serve: days or weeks.
In enterprise, track both "time to technical go-live" and "time to business outcome achievement" as separate but related metrics. They are related but not the same.
The fastest path to retention is proof of value. Early!
Layer 3: The Sentiment Signal
Numbers don’t renew. People do.
Net Promoter Score (NPS) and why it fails in enterprise. NPS measures loyalty intent but often fails to predict churn in enterprise because end users love the product while the economic buyer doesn't see ROI.
The fix is segmentation by influence: survey economic buyers, champions, and end users separately. Weigh the economic buyer materially higher than the end users, based on proven renewal correlation. In enterprise SaaS with high-touch CS, the person using the product daily rarely controls the renewal decision.
For strategic accounts, consider replacing broad NPS surveys with executive relationship scorecards: frequency of C-suite engagement, participation in strategic planning sessions, joint success plan progress, and executive sponsor advocacy, both internally and externally.
Advocacy Yield (sentiment that becomes leverage) is how many new opportunities each satisfied customer influences. It is the most strategic sentiment metric of all, because it converts satisfaction into revenue leverage. Track reference calls provided, case studies published, reviews, and customer referrals.
In enterprise, advocacy often takes different high-signal forms: speaking opportunities at your user conference, participation in customer advisory boards (CAB), co-innovation partnerships, or public case studies. A strategic customer who serves as a named reference or participates in your CAB is more likely to renew and expand.

The Five Retention Traps (and the fixes)
Mistake 1: Tracking logo churn while ignoring ARR churn
Your logo churn looks acceptable. But ARR churn tells you you’re losing the accounts that matter. Always report both, segmented by customer size.
Fix: track customer concentration, monthly churn scorecard with both metrics plus top 10 ARR loss risk.
Mistake 2: Celebrating NRR without checking distribution
Your NRR is 122%, but expansion comes entirely from customers acquired 3+ years ago. Newer cohorts are at 95% NRR. Report NRR by vintage cohort monthly.
Fix: cohort NRR/GRR heatmap; expansion mix by tenure band.
Mistake 3: Building a health score that doesn't predict anything
Dashboards glow green; renewals give surprises.
Fix: Backtest health score against renewals quarterly. Require measurable separation: “red accounts renew at X%, green at Y%.” Publish the top 3 predictive behaviors (the retention “physics”) and operationalize them.
Mistake 4: Surveying end users and calling it "customer feedback"
End users give you a strong NPS. Then, major accounts don't renew because the CFO didn't see ROI.
In enterprise and strategic accounts, this disconnect is fatal. The procurement team, finance, and executive sponsors control renewal decisions, often with minimal input from daily users.
Fix: Split surveys by stakeholder class (users vs. champions vs. value owners); weight the response set intentionally; track “commercial sentiment”: budget pressure, reorg risk, procurement posture; make QEBRs the primary relationship health instrument for strategic accounts.
Mistake 5: Reporting averages instead of distributions
Your average renewal rate is 92%. But small customers renew at 78% while large customers renew at 98%. The average hides the operating truth.
Fix: renewal rate by ACV band (and bottom/top-quartile controls) and by segments.

What to Measure at Each Maturity Stage
Your metrics strategy should evolve as your company matures. ARR ranges are loosely correlated with maturity, but they’re not the driver. The real evolution is how you run retention.
Stage 1: Reactive retention
Critical metrics: GRR, logo churn, basic renewals, TTV
Objective: stop the bleeding, stabilise value delivery, prove customers can succeed, shorten TTV.
Stage 2: Managed retention
Critical metrics: segmented renewal rate, cohort views, early health signals.
Objective: systematise playbooks and coverage discipline to anticipate risk before it becomes churn and stabilise renewal forecast.
Stage 3: Predictive retention
Critical metrics: NRR/GRR by cohort, adoption depth, validated health score.
Objective: risk prediction and intervention - manage renewals 6-9 months early.
Stage 4: Strategic retention
Critical metrics: expansion mix, price realisation, advocacy yield, LTV: CAC by segment, executive relationship strength.
Objective: drive compounding growth through expansion, establish executive-level partnerships, and demonstrate strategic value beyond product features.
For high-touch strategic accounts portfolios, add account-level tracking: executive-sponsor stability, multi-year-contract conversion rate, strategic-initiative alignment, and co-innovation engagement.
The Diagnostic Checklist
Answer these questions. If you answer "no" to more than three, your metrics program needs work:
Can you segment NRR by customer cohort and see a clear trend?
Do you track both logo churn and ARR churn separately?
Is your renewal rate calculated based on customers eligible to renew?
Have you backtested your health score against 12+ months of renewal data?
Can you identify the top 3 product usage behaviors that predict renewal?
Do you survey economic buyers separately from end users?
Can you explain what drove your NRR last quarter in a single slide?
Do you have a documented definition of "first value" tied to a customer KPI?
Can you tell the renewal rate of bottom vs. top quartile customers?
Do you have a monthly CS scorecard that takes less than 10 minutes to review?

The Long Game of Success - The Path Forward
Customer Success isn’t about defending renewals. It’s about compounding trust. Customer Success metrics aren't a reporting exercise. They're an operating system, especially in high-touch strategic accounts where relationship depth, executive alignment, and business outcome achievement matter as much as product usage.
The best CS teams use metrics to make decisions daily: which accounts to prioritise, where to invest in automation, when to escalate risk, and how to forecast with confidence.
Start with the foundation: NRR, GRR, renewal rate, and churn (segmented by cohort and customer size). Add a health score only when you have enough data to validate it, and weight relationship quality heavily for strategic accounts. Layer in engagement and sentiment metrics as your CS motion matures. And design your system to spot risk 6-9 months before renewal, not 30 days before.
The companies that master this don't just retain customers. They build compounding growth engines where every cohort becomes more valuable than the last. In enterprise SaaS, that is how Customer Success stops being a service function and becomes a strategic revenue driver. That is not inspiration. That is precision. That is the long game of success.
Upcoming in the KPI series
Metrics That Seduce Investors - what boards truly reward (and what they quietly discount), even when the dashboard looks perfect.